

- Mar 7, 2005
- 9,018
- 6,900
Title's my own, but the rest is an excellent article by Zach Slatton taken from Forbes.com (http://www.forbes.com/sites/zachsla...urs-demonstrate-how-the-epl-table-lies-to-us/)
Arsenal and Spurs Demonstrate How the EPL Table Lies To Us
Arsenal and Spurs Demonstrate How the EPL Table Lies To Us
A few weeks ago this blog explained how Arsenal’s Champions League qualifications have been living on luck as of late, and understandably a few Arsenal supporters took issue with the article’s conclusions. Some wanted more details on the statistical methodology used within the article, while others seemed unwilling to accept that teams being tightly bunched around a few point totals in the table meant luck played a roll in how the table turned out. Surely other factors like goal differential and the teams’ play that was behind the goal differentials must have had some role in where each of the teams ended up relative to each other, right?
Such commentary provides a great way to examine how our view of results ex post facto via single point data summarizing an entire season (points, goal differential, etc.) erroneously colors our view of how things happened. Using such summary data within the league table gives us a false sense of just how deterministic things are within the league, and provides us with only a single view of the multiple realities that were equally possible but just didn’t happen because of random events falling one way versus another.
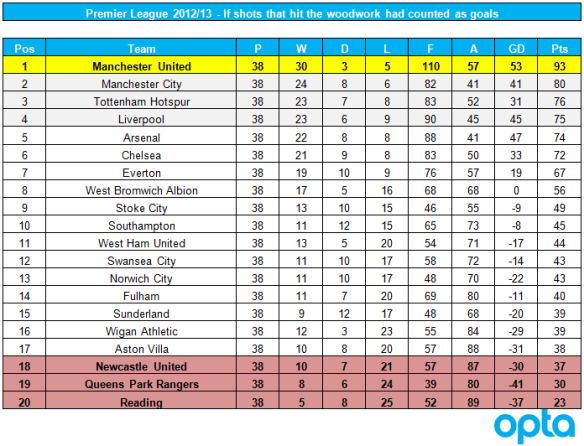
It all starts with the fundamental flaw in the way one traditionally views the league table. Originally constructed when space on a newspaper page was valuable and sports statistics didn’t necessarily help drive ad revenue, fans who consumed the weekly league table could have been forgiven for being more interested in a match summary’s flowery language than demanding the basic table tell them anything more than who was in the top four or five teams versus who was fighting off relegation. All that mattered then was showing the order of the teams and a few summary statistics of how that order had been derived, but in presenting teams in equidistant vertical spacing the league table presents the erroneous message of uniform compactness to this day. As an example, see the final 2012-13 Premier League table below, where none of the compactness in the second through fifth teams jumps out at the reader along with the parity found further down the table.
 The step function in financial rewards and reputation enhancement based upon certain finish positions makes club comparison by table position even more flawed. Examples of such step functions include a Top Four finish that equates to tens of millions of British pounds of Champions League revenue, while avoiding the drop and staying in the Premier League guarantees another year of at least forty million pounds in television revenue. These step functions in revenue cause us to pay far more attention to table position than we should when the core of our focus should be on relative team quality over a season and how much real differentiation there may or may not be in potential point totals. Ultimately, the mental model of a table that is visually structured around table position leads to a mentality of artificial and uniform differentiation when there may be more or less differentiation than the table can possibly capture.
There are alternatives to the traditional league table. Jenny Cann, an Arsenal supporter, popularized a method of reconceptualizing the table and centering it instead on points, then goal differential, and finally games in hand. It’s a simple tool using the same data as the traditional table, but it accomplishes the goal of not only communicating table order but also the magnitudes of the gaps between the teams. This method of viewing the league table begins to correctly communicate just how fragile or secure a clubs’ table position is relative to the clubs around it in the table. A few additions can be made to the Cann table to further increase its usefulness. In the case of the 2012/13 table below, the bounds of the table have been set to the maximum and minimum points possible in a season. Further enhancements could have been made to indicate the maximum points ever earned by a Premier League champion – 95 by the 2004/05 Chelsea title winners – and minimum points earned for a top four finish. Things have been kept simple in the table below to help illustrate another point later in this post.
 Yet even the Cann table leaves a good bit to be desired. What if Juan Mata’s 87th minute shot hadn’t been deflected in for Chelsea’s game-winning goal at Manchester United late in the season, and then Frank Lampard hadn’t scored an 88th minute goal for Chelsea at Aston Villa in their penultimate game? Tottenham wouldn’t have been as close as a single point to Arsenal if not foran Emmerson Boyce 89th minute own goal against Wigan, and they would have been further behind the Gunners had Gareth Bale not scored a 90thminute game winner against West Ham United. The Arsenal blog7AMKickoff.com noted numerous close calls for the Gunners, including their1-0 away win at Sunderland containing four wasted big chances by Sunderland in the second half alone and two big chances missed by West Bromwich Albion during Arsenal’s 2-1 win (with the added difficulty of Arsenal seeing a player sent off in both matches). Any of these events turning out differently than they did would have changed the order of third through fifth place in last season’s table. That is to say, the clubs’ table positions hinged on the outcome of those and many other random events. All three table positions were determined by luck. How do we take such luck into account when looking at a table?
James Grayson has proposed a method for quantifying the impact random variation, or luck, has on a club’s point totals. His research indicates random variation results in a standard deviation in point total of 8.18 points over an English Premier League season. What does this mean for Arsenal’s, Chelsea’s, and Tottenham’s possible point totals in the 2012/13 season? To answer this question a 10,000 run Monte Carlo simulation was completed by generating normal distributions of the top six team’s point totals using their final point totals from the season and the standard deviation due to random variation. The results of the Monte Carlo simulation were then translated into the likelihood of the team achieving each one of the point totals. The plot below shows each team’s projected distribution of point totals, which essentially flips the table on its side given point totals are now on the x-axis of the graph. Distributions further to the right represent higher point totals.
 Note how Everton and Manchester United are the only two teams with distributions that are visually separate from the main pack of the other four teams in the table’s second through fifth positions. The clustering of these four clubs demonstrates how Manchester City could just have easily finished third or fourth last season, while Tottenham could have easily finished second or third. Further insight comes when all of the other teams are eliminated from the graph and only Arsenal and Tottenham remain.
 Notice that the distributions for both teams are nearly identical, with the only difference coming in the slight shift to the right that favors Arsenal given their single higher point last season. In a statistical sense, the difference between these two distributions is not significant. If one were to randomly sample point totals from the two distributions they would find plenty of occasions where Tottenham’s point total would be greater than Arsenal’s and thus replace them as the fourth Champions League qualifier from the Premier League in 2012/13.
Arsenal’s projected 2012/13 point distribution using Grayson’s data also tells us something about their performance during the previous two seasons. In 2012/13 the Gunners finished with 73 points, three points better than their 2011/12 total (70) and five better than the 2010/11 total (68). This might lead some to say Arsenal is an improving team, but such a declaration would ignore statistical reality. Arsenal’s point total in 2012/13 and normal, run-of-the-mill variation around that point total says that a team that earns 73 points actually has a 50% chance of finishing with as few as 68 or as many as 78 points. In a statistical sense, this is the 50th percentile prediction interval for the 73 point total, and this blog typically uses that interval to set the bounds for expected noise around an average value. The fact that the point total has increased the last two seasons is simply an artifact of a low sample size. Rather than declaring Arsenal’s fortunes are improving, the statistician would say they are actually performing consistently when it comes to points.
So why does this mean Arsenal is living on luck? Such a declaration can be made when Arsenal’s Champions League likelihoods are viewed in the longer term. Their actual point totals relative to every other club’s actual point totals over the last three seasons translate into the following likelihoods of Champions League qualification when random variation in point totals is used to create a 10,000 run Monte Carlo simulation of each season’s projected point totals:
 It turns out that Arsenal’s likelihood of not qualifying for all three Champions League competitions was more than two-to-one. The most likely outcome was Arsenal qualifying for only two out of the three possible Champions League campaigns. Meanwhile, Tottenham Hotspur had a nearly ten-to-one chance of qualifying for at least one Champions League position over the last three seasons. It’s not just predictive models that are telling us how rare Arsenal’s three Champions League qualifications have been, but also retrospective statistics as well.
It’s easy to look at a table and build a narrative that fits it. It is one of the clearest examples of scoreboard journalism, a term increasingly popularized by statistician Simon Gleave. It constructs the story of team quality around a single set of summary statistics, simplifying the story of a season by ignoring the alternative realities of how things could have just as easily unfolded very differently. This means that the league table lies to us, because it only shows us one of the many alternative outcomes that could have happened if a ball had bounced slightly differently, a shot had gone off the inside of the woodwork rather than hit it straight on and bounced out for a goal kick, or any other event whose outcome would have greatly changed the scoreline of a match and over which players and managers have minimal to no control. The table lies to use by constructing a definitive, single point reality in a sport filled with lots of variation and distributions of possible outcomes. As authors Chris Anderson and David Sally explain in The Numbers Game, the rarity of the goal means a soccer match is an unpredictable event where luck determines fifty per cent of the match’s outcome. That role of luck in a match shows up in wide variations in point totals over a season, variation that the current league table refuses to express.
To believe that a manager like Arsene Wenger can consistently control his team’s performance relative to others to within a single point when the data says point totals easily vary by eight points just due to random events is the height of denying luck’s roll in the final table. Wenger and Arsenal are extremely lucky to have qualified for as many Champions Leagues tournaments as they have given the razor thin margins they’ve maintained the last few seasons. The same can be said of Chelsea given their point totals and their sixth place finish two seasons ago, and it’s one of the many reasons why owner Roman Abramovich was not satisfied with the performances of managers Andre Villas-Boas and Roberto Di Mateo. Meanwhile, Spurs have certainly been unlucky not just in finishing one point behind Arsenal the last two seasons, but also in the fact that when they actually did finish in a Champions League position two years ago they found themselves excluded from the 2012/13 tournament given Chelsea’s 2011/12 Champions League title while finishing sixth in the Premier League. If Wenger and Arsenal do nothing to separate themselves from the second pack of three teams in the Premier League – that is, spend more money on better players compared to the competition – they will continue to leave their Champions League hopes up to luck. At some point that luck will run out, and they will only have themselves to blame for not taking more control over their own destiny.
Such commentary provides a great way to examine how our view of results ex post facto via single point data summarizing an entire season (points, goal differential, etc.) erroneously colors our view of how things happened. Using such summary data within the league table gives us a false sense of just how deterministic things are within the league, and provides us with only a single view of the multiple realities that were equally possible but just didn’t happen because of random events falling one way versus another.
It all starts with the fundamental flaw in the way one traditionally views the league table. Originally constructed when space on a newspaper page was valuable and sports statistics didn’t necessarily help drive ad revenue, fans who consumed the weekly league table could have been forgiven for being more interested in a match summary’s flowery language than demanding the basic table tell them anything more than who was in the top four or five teams versus who was fighting off relegation. All that mattered then was showing the order of the teams and a few summary statistics of how that order had been derived, but in presenting teams in equidistant vertical spacing the league table presents the erroneous message of uniform compactness to this day. As an example, see the final 2012-13 Premier League table below, where none of the compactness in the second through fifth teams jumps out at the reader along with the parity found further down the table.

There are alternatives to the traditional league table. Jenny Cann, an Arsenal supporter, popularized a method of reconceptualizing the table and centering it instead on points, then goal differential, and finally games in hand. It’s a simple tool using the same data as the traditional table, but it accomplishes the goal of not only communicating table order but also the magnitudes of the gaps between the teams. This method of viewing the league table begins to correctly communicate just how fragile or secure a clubs’ table position is relative to the clubs around it in the table. A few additions can be made to the Cann table to further increase its usefulness. In the case of the 2012/13 table below, the bounds of the table have been set to the maximum and minimum points possible in a season. Further enhancements could have been made to indicate the maximum points ever earned by a Premier League champion – 95 by the 2004/05 Chelsea title winners – and minimum points earned for a top four finish. Things have been kept simple in the table below to help illustrate another point later in this post.

James Grayson has proposed a method for quantifying the impact random variation, or luck, has on a club’s point totals. His research indicates random variation results in a standard deviation in point total of 8.18 points over an English Premier League season. What does this mean for Arsenal’s, Chelsea’s, and Tottenham’s possible point totals in the 2012/13 season? To answer this question a 10,000 run Monte Carlo simulation was completed by generating normal distributions of the top six team’s point totals using their final point totals from the season and the standard deviation due to random variation. The results of the Monte Carlo simulation were then translated into the likelihood of the team achieving each one of the point totals. The plot below shows each team’s projected distribution of point totals, which essentially flips the table on its side given point totals are now on the x-axis of the graph. Distributions further to the right represent higher point totals.


Arsenal’s projected 2012/13 point distribution using Grayson’s data also tells us something about their performance during the previous two seasons. In 2012/13 the Gunners finished with 73 points, three points better than their 2011/12 total (70) and five better than the 2010/11 total (68). This might lead some to say Arsenal is an improving team, but such a declaration would ignore statistical reality. Arsenal’s point total in 2012/13 and normal, run-of-the-mill variation around that point total says that a team that earns 73 points actually has a 50% chance of finishing with as few as 68 or as many as 78 points. In a statistical sense, this is the 50th percentile prediction interval for the 73 point total, and this blog typically uses that interval to set the bounds for expected noise around an average value. The fact that the point total has increased the last two seasons is simply an artifact of a low sample size. Rather than declaring Arsenal’s fortunes are improving, the statistician would say they are actually performing consistently when it comes to points.
So why does this mean Arsenal is living on luck? Such a declaration can be made when Arsenal’s Champions League likelihoods are viewed in the longer term. Their actual point totals relative to every other club’s actual point totals over the last three seasons translate into the following likelihoods of Champions League qualification when random variation in point totals is used to create a 10,000 run Monte Carlo simulation of each season’s projected point totals:
- 2010/11: 72.6% of top four finish
- 2011/12: 66.2% of top four finish
- 2012/13: 65.7% of top four finish
It’s easy to look at a table and build a narrative that fits it. It is one of the clearest examples of scoreboard journalism, a term increasingly popularized by statistician Simon Gleave. It constructs the story of team quality around a single set of summary statistics, simplifying the story of a season by ignoring the alternative realities of how things could have just as easily unfolded very differently. This means that the league table lies to us, because it only shows us one of the many alternative outcomes that could have happened if a ball had bounced slightly differently, a shot had gone off the inside of the woodwork rather than hit it straight on and bounced out for a goal kick, or any other event whose outcome would have greatly changed the scoreline of a match and over which players and managers have minimal to no control. The table lies to use by constructing a definitive, single point reality in a sport filled with lots of variation and distributions of possible outcomes. As authors Chris Anderson and David Sally explain in The Numbers Game, the rarity of the goal means a soccer match is an unpredictable event where luck determines fifty per cent of the match’s outcome. That role of luck in a match shows up in wide variations in point totals over a season, variation that the current league table refuses to express.
To believe that a manager like Arsene Wenger can consistently control his team’s performance relative to others to within a single point when the data says point totals easily vary by eight points just due to random events is the height of denying luck’s roll in the final table. Wenger and Arsenal are extremely lucky to have qualified for as many Champions Leagues tournaments as they have given the razor thin margins they’ve maintained the last few seasons. The same can be said of Chelsea given their point totals and their sixth place finish two seasons ago, and it’s one of the many reasons why owner Roman Abramovich was not satisfied with the performances of managers Andre Villas-Boas and Roberto Di Mateo. Meanwhile, Spurs have certainly been unlucky not just in finishing one point behind Arsenal the last two seasons, but also in the fact that when they actually did finish in a Champions League position two years ago they found themselves excluded from the 2012/13 tournament given Chelsea’s 2011/12 Champions League title while finishing sixth in the Premier League. If Wenger and Arsenal do nothing to separate themselves from the second pack of three teams in the Premier League – that is, spend more money on better players compared to the competition – they will continue to leave their Champions League hopes up to luck. At some point that luck will run out, and they will only have themselves to blame for not taking more control over their own destiny.
")